
The 30 Most Expensive States for Car Insurance

What drivers spend on car insurance depends a lot on where they live. In 2023, the average driver in the most expensive state spent more than twice as much per car as the average driver in the cheapest one.
How this list is ranked: every state below is ranked by its average auto insurance expenditure for 2023, taken from Table 4 of the 2022/2023 Auto Insurance Database Report published by the National Association of Insurance Commissioners (NAIC), the organization of state insurance regulators. It’s the latest year in the report, which was adopted in December 2025. The District of Columbia ($1,676.99) is left out because it isn’t a state.
The NAIC figure is the total premium written for liability, collision and comprehensive coverage, divided by the number of insured vehicles (counted as “car-years,” or one car insured for a full year). It’s an estimate of what consumers in each state actually spent per insured car, on average. Across the whole country, that figure was $1,281.92 in 2023, up 13.99% from $1,124.57 in 2022.
Each entry also gives the state’s combined average premium from the same report (Table 5), which adds up the average liability, collision and comprehensive premiums, plus the state’s minimum liability insurance limits under current law. Limits are written the usual way: 25/50/25 means $25,000 for injury to one person, $50,000 for all injuries in one crash and $25,000 for property damage.
Each entry also uses other state figures from the same NAIC report: the average premium for each main type of coverage in 2023 (the national averages were $736.65 for liability, $463.71 for collision and $238.24 for comprehensive), and 2022 figures on traffic, road deaths, vehicle thefts and income. When an entry ranks a state on one of these, it counts the 50 states only.
1. Florida: $1,864.63 per Insured Car
Florida is the most expensive state for car insurance in the NAIC data. The average expenditure was $1,864.63 per insured vehicle in 2023, about $583 more than the national average.
It also had the biggest one-year jump of any state on this list. Florida’s average was $1,567.88 in 2022, so it rose about 18.9% in a single year. Its combined average premium was $1,993.81.
Florida is a no-fault state, and its minimum requirements are unusual. Florida Statutes § 324.022 sets a $10,000 property damage requirement, and drivers must also carry $10,000 of personal injury protection (PIP). The state’s basic requirement doesn’t include bodily injury liability coverage.
Most of that cost is liability coverage. Florida’s average liability premium was $1,294.57 in 2023, the highest of all 50 states and about $558 above the national average of $736.65. Its average collision premium ($468.92) was close to the national figure, and its comprehensive premium ($230.32) was slightly below it. Florida’s roads are also crowded: the NAIC report counts 1,839,471 vehicle miles driven per mile of highway in 2022, the third most of any state. Over five years, Florida’s average expenditure rose 25.2%, from $1,488.73 in 2019.
2. Louisiana: $1,754.03 per Insured Car
Louisiana ranks second, with an average expenditure of $1,754.03 per insured vehicle in 2023. That was up about 12.6% from $1,557.99 in 2022.
Louisiana’s combined average premium was $1,982.65, the second highest of any state and only about $11 behind Florida’s.
Unlike Florida, Louisiana is a traditional at-fault (tort) state. Its minimum liability limits are 15/30/25, which means a lower requirement for injuries than most states but a $25,000 requirement for property damage.
Louisiana is expensive across the board. Its average liability premium was $1,055.10 in 2023, the third highest in the country, and its average collision premium was $581.47, second only to California. Comprehensive coverage averaged $346.08, the seventh highest. The NAIC report puts Louisiana’s per capita disposable income at $49,340 in 2022, below the national figure of $56,062, and lists a fatal accident rate of 1.60 per 100 million vehicle miles, compared with 1.33 nationwide. Louisiana’s average expenditure was already $1,560.00 in 2019, so its five-year rise (12.4%) was much smaller than Florida’s.
3. New York: $1,752.55 per Insured Car

New York finished just $1.48 behind Louisiana. The average expenditure was $1,752.55 per insured vehicle in 2023, up about 13.2% from $1,548.26 in 2022. Its combined average premium was $1,895.99.
New York is a no-fault state, and its required coverage is broader than most. Drivers need liability limits of 25/50/10, plus $50,000 for the death of one person and $100,000 for the death of two or more in one accident. New York policies must also include $50,000 of no-fault personal injury protection.
Under New York’s no-fault system, a person can generally only sue another driver for pain and suffering after a “serious injury” as the law defines it, which the NAIC lists as a verbal threshold.
New York’s liability premium was the second highest in the country, averaging $1,115.97 in 2023, behind only Florida. Its average collision premium was $541.06, the fourth highest, while comprehensive coverage, at $238.96, was almost exactly the national average. Over five years, the state’s average expenditure climbed 21.2%, from $1,446.14 in 2019. New York’s roads are safer than most: its fatal accident rate was 1.02 per 100 million vehicle miles in 2022, among the ten lowest of any state and below the national rate of 1.33.
4. New Jersey: $1,573.21 per Insured Car

New Jersey ranks fourth, with an average expenditure of $1,573.21 per insured vehicle in 2023. That was up about 11.5% from $1,411.47 in 2022. Its combined average premium was $1,693.39.
New Jersey is a no-fault state where the policyholder picks the right to sue. The NAIC lists its threshold as “choice or verbal,” depending on the option chosen.
The state’s minimum limits have also gone up since 2023. For policies issued or renewed on or after January 1, 2026, the standard policy’s bodily injury minimums are $35,000 per person and $70,000 per accident, with $25,000 for property damage.
New Jersey fits the NAIC’s description of a high-premium state closely. It’s the most densely populated state, with 1,264 people per square mile in 2022, and it had the second-heaviest road traffic in the report: 1,941,271 vehicle miles per highway mile. Its per capita disposable income ($64,683) was the fifth highest. Liability coverage averaged $1,032.50 in 2023, the sixth highest, and collision averaged $490.55. Comprehensive coverage was cheaper than in most states, at $170.34.
5. Georgia: $1,555.10 per Insured Car

Georgia ranks fifth. Its average expenditure was $1,555.10 per insured vehicle in 2023.
That figure rose about 15.6% in one year, from $1,345.38 in 2022. Georgia’s combined average premium was $1,746.32, higher than New Jersey’s.
Georgia is an at-fault (tort) state with minimum liability limits of 25/50/25.
Georgia’s liability premium was the fourth highest in the country, averaging $1,046.30 in 2023, compared with $736.65 nationally. Collision coverage averaged $473.22 and comprehensive $226.80, both close to the national averages. Georgia drivers also cover a lot of ground: the NAIC report lists 14,422 vehicle miles per registered vehicle in 2022, well above the national figure of 11,708. Over five years, the state’s average expenditure rose 23.0%, from $1,264.81 in 2019, while its per capita disposable income ($48,920 in 2022) stayed below the national level.
6. Rhode Island: $1,539.65 per Insured Car

Rhode Island is the smallest state on the list and the most expensive in New England. Its average expenditure was $1,539.65 per insured vehicle in 2023.
Rhode Island had one of the smallest increases in the top 30: about 8.2%, from $1,422.82 in 2022. Its combined average premium was $1,709.69.
Rhode Island is an at-fault (tort) state. Its minimum limits are 25/50/25, or a $75,000 combined single limit.
Rhode Island’s high price comes from both liability and collision coverage. Its average liability premium was $984.27 in 2023, the seventh highest, and its average collision premium was $539.91, the fifth highest. It’s the second most densely populated state in the NAIC report, with 1,063 people per square mile in 2022, behind only New Jersey. Yet it had the lowest fatal accident rate of any state: 0.69 per 100 million vehicle miles in 2022. Its average expenditure barely moved between 2021 ($1,421.29) and 2022 ($1,422.82) before rising in 2023.
7. Maryland: $1,476.78 per Insured Car
Maryland ranks seventh, with an average expenditure of $1,476.78 per insured vehicle in 2023. That was up about 15.3% from $1,281.25 in 2022. Its combined average premium was $1,601.63.
The NAIC lists Maryland as an “add-on” state: it keeps the at-fault system, but personal injury protection is added on top. Maryland’s minimum liability limits are 30/60/15, and PIP is required unless it is waived.
Maryland’s roads are among the busiest in the country. The NAIC report counts 1,742,162 vehicle miles per highway mile in 2022, the fourth highest, and 638 people per square mile, making it the fifth most densely populated state. Its average collision premium was $513.43 in 2023, the eighth highest, and liability coverage averaged $868.68. Comprehensive coverage, at $219.52, was a little below the national average of $238.24. The state’s average expenditure rose 19.9% over five years, from $1,231.51 in 2019.
8. Delaware: $1,462.03 per Insured Car
Delaware ranks eighth, with an average expenditure of $1,462.03 per insured vehicle in 2023. That was up about 12.8% from $1,296.14 in 2022. Its combined average premium was $1,569.21.
The NAIC classifies Delaware as a no-fault state with no lawsuit threshold, meaning drivers carry personal injury protection but keep the right to sue. Delaware’s minimum liability limits are 25/50/10.
Most of Delaware’s cost is liability coverage. Its average liability premium was $962.42 in 2023, the eighth highest in the country, while its average collision premium ($422.80) was below the national average of $463.71. The state also had one of the higher fatal accident rates in the NAIC report, 1.64 per 100 million vehicle miles in 2022, compared with 1.33 nationally, and its vehicle theft rate of 4.03 per 1,000 registered vehicles was above the national rate of 3.47. Delaware’s average expenditure rose 13.6% over five years, from $1,286.99 in 2019.
9. Nevada: $1,461.54 per Insured Car

Nevada finished just 49 cents behind Delaware. Its average expenditure was $1,461.54 per insured vehicle in 2023, up about 13.2% from $1,291.11 in 2022. Its combined average premium was $1,600.12.
Nevada is the most expensive state in the West in the NAIC data. It’s an at-fault (tort) state with minimum liability limits of 25/50/20.
Nevada’s average liability premium was $1,040.03 in 2023, the fifth highest in the country. Comprehensive coverage was the opposite: at $135.76, it was the second cheapest of any state, despite Nevada having the fifth-highest vehicle theft rate in the NAIC report (6.04 thefts per 1,000 registered vehicles in 2022). The state is sparsely populated overall, with 29 people per square mile, but highly urban: 94.1% of residents lived in urban areas in 2020. Its average expenditure was $1,292.58 in 2019, so it rose 13.1% over five years.
10. Colorado: $1,452.82 per Insured Car
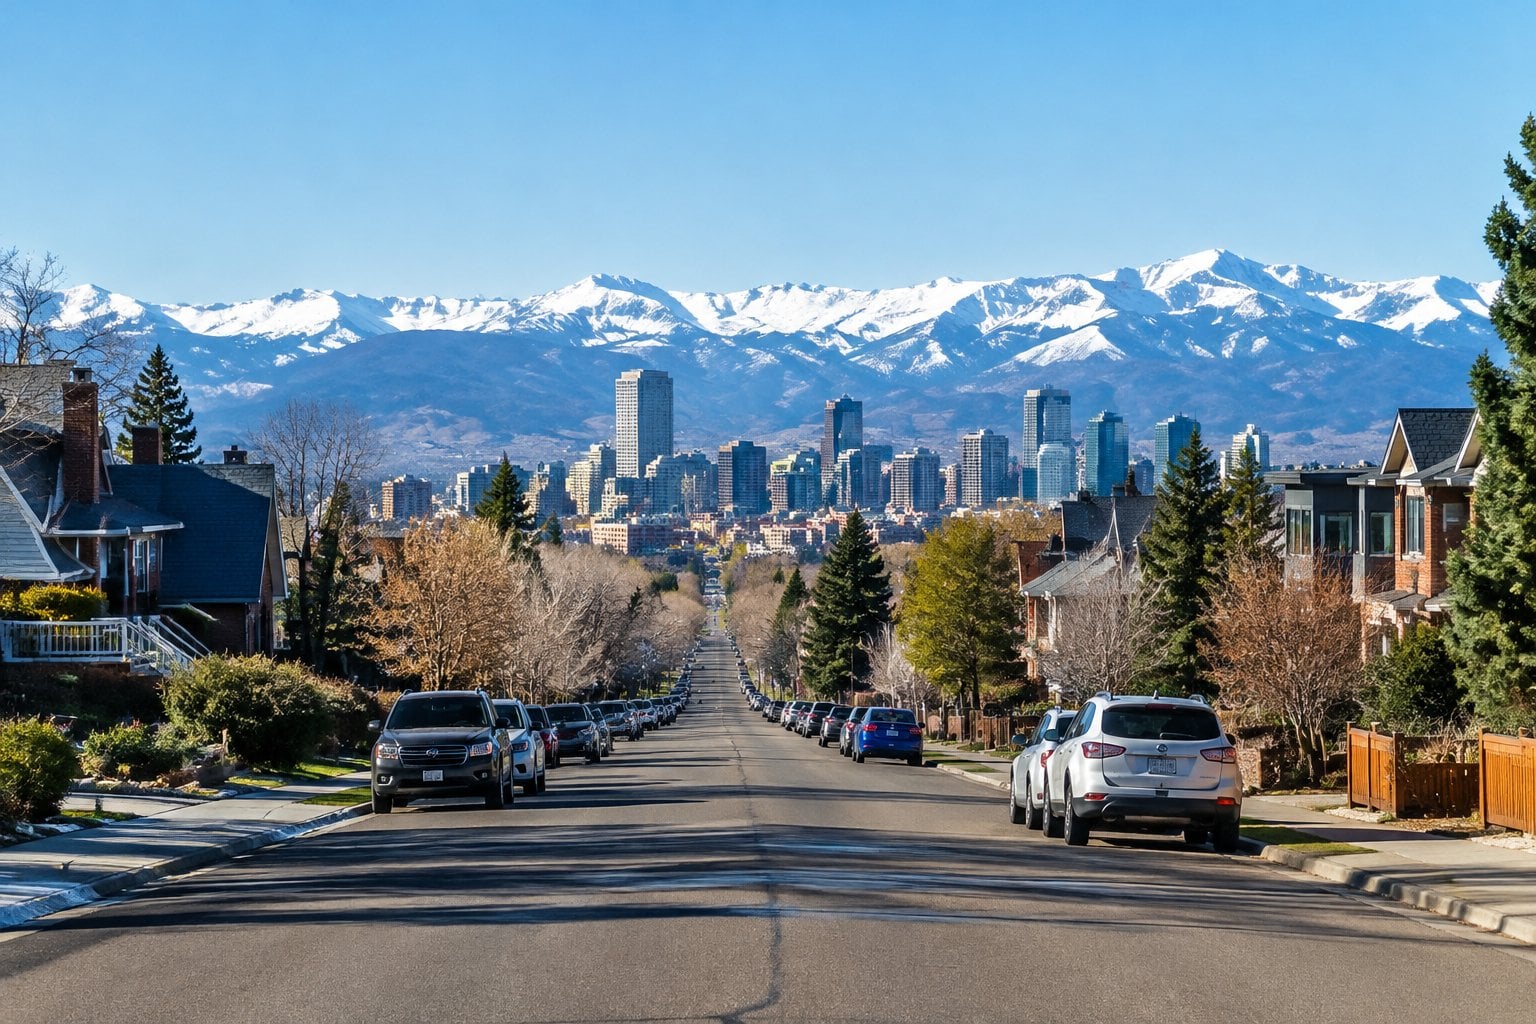
Colorado rounds out the top 10, with an average expenditure of $1,452.82 per insured vehicle in 2023. That was up about 14.0% from $1,274.60 in 2022.
Colorado’s combined average premium was $1,655.30, the eighth highest of any state and higher than Maryland’s, Delaware’s or Nevada’s.
Colorado is an at-fault (tort) state. Its minimum liability limits are 25/50/15.
Colorado stands out for comprehensive coverage, which pays for damage not caused by a crash, such as theft, fire, vandalism and weather. Its average comprehensive premium was $446.80 in 2023, the third highest in the country and almost twice the national average of $238.24. That figure was $298.92 in 2019. Colorado also had the highest vehicle theft rate of any state in the NAIC report: 9.36 thefts per 1,000 registered vehicles in 2022, up from 5.89 in 2020. Its liability premium ($781.90) was closer to the national average. Overall, the state’s average expenditure rose 23.6% from 2019.
11. Michigan: $1,444.01 per Insured Car
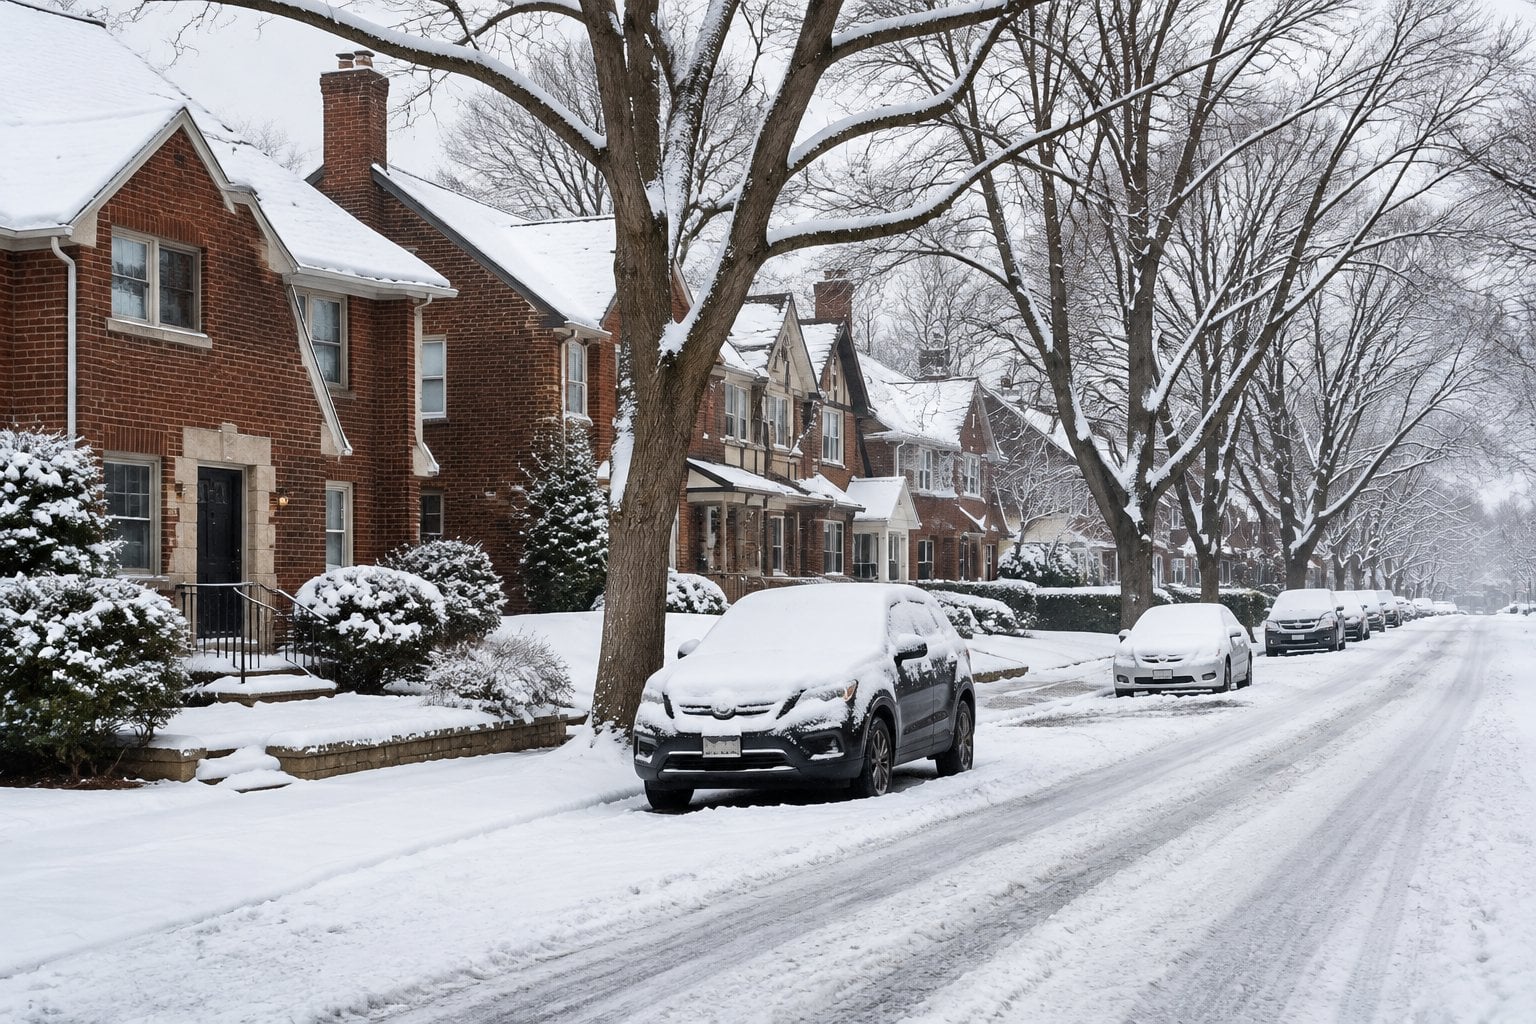
Michigan ranks 11th, with an average expenditure of $1,444.01 per insured vehicle in 2023. Its combined average premium was $1,572.77.
Michigan had the smallest one-year increase on this list: about 7.8%, from $1,339.53 in 2022. In 2019, before the state’s 2020 no-fault changes took effect, the NAIC figure for Michigan was $1,498.59.
Michigan is a no-fault state. Under Michigan Compiled Laws § 500.3009, the default liability limits are 250/500/10, and drivers can choose lower limits, but not below 50/100/10.
Michigan is the only state on this list where the average expenditure was lower in 2023 than in 2019, down 3.6%. Its average liability premium fell every year in that span, from $981.16 in 2019 to $765.72 in 2023. Collision coverage moved the other way: Michigan’s average collision premium was $570.16 in 2023, the third highest in the country, up from $479.29 in 2019. Comprehensive averaged $236.90, almost the same as the national figure of $238.24.
12. Texas: $1,428.94 per Insured Car
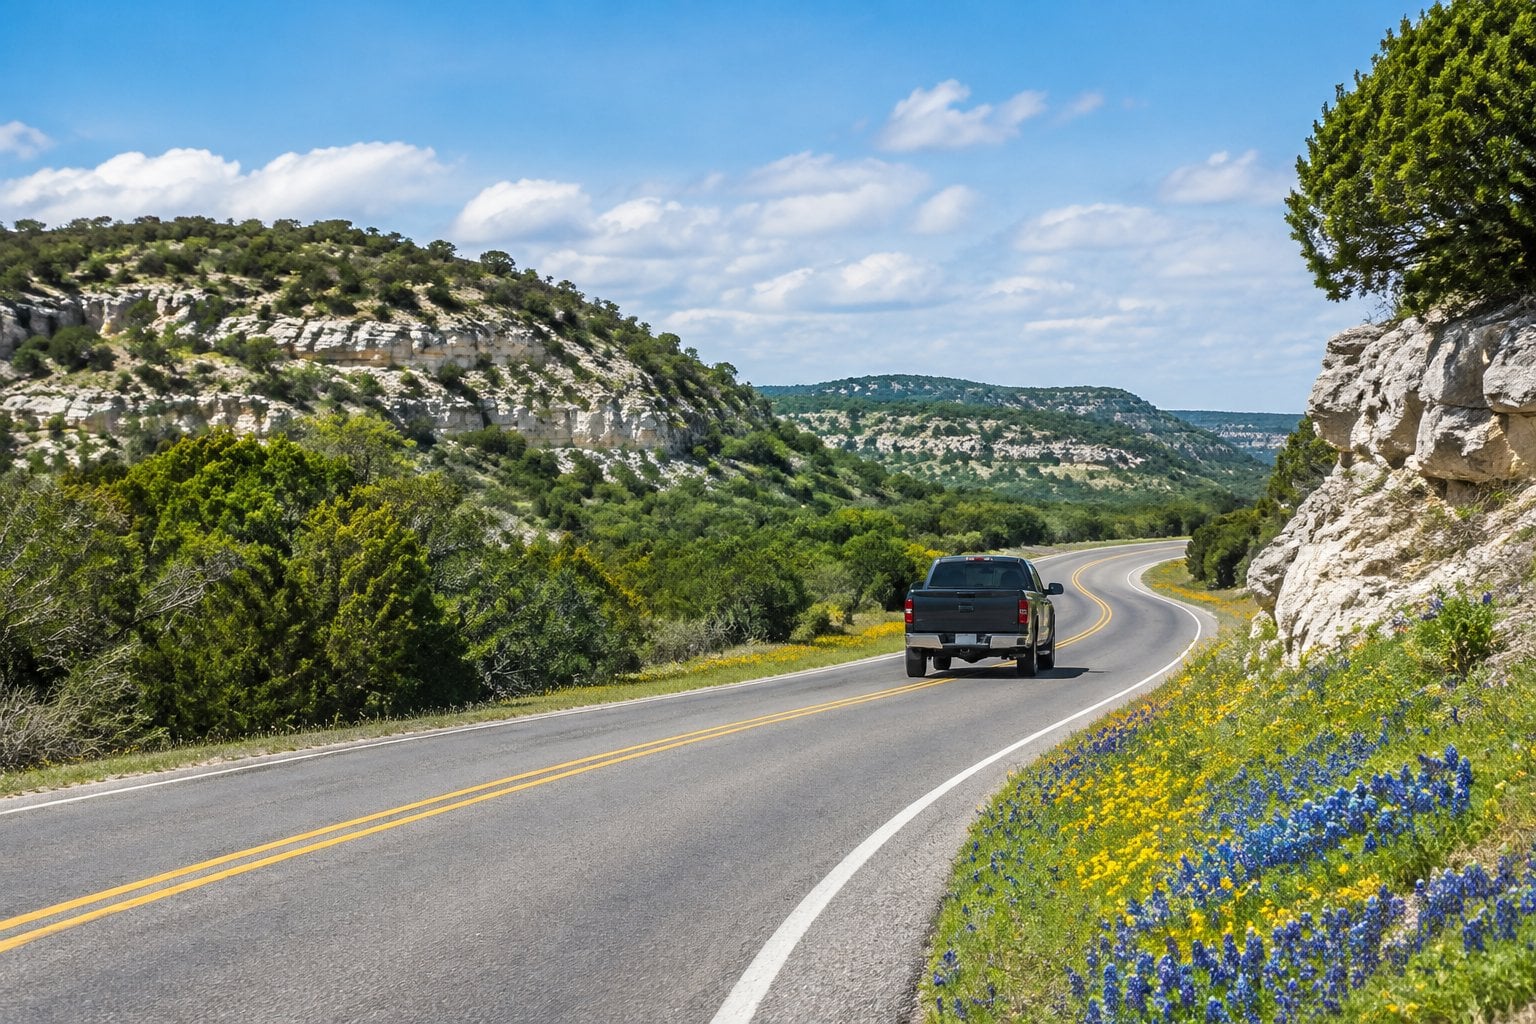
Texas ranks 12th, with an average expenditure of $1,428.94 per insured vehicle in 2023.
That was up about 15.9% from $1,232.79 in 2022, one of the bigger increases on the list. Texas’s combined average premium was $1,726.91, higher than New Jersey’s or Rhode Island’s.
Texas is an at-fault (tort) state with minimum liability limits of 30/60/25.
Texas’s physical damage coverage is especially pricey. Its average collision premium was $529.05 in 2023, the sixth highest, and its comprehensive premium was $400.01, the fourth highest and up from $285.59 in 2019. Liability coverage averaged $797.86, above the national average of $736.65. Texas also had a vehicle theft rate of 4.35 per 1,000 registered vehicles in 2022, the ninth highest in the NAIC report. Over five years, its average expenditure rose 24.9%, from $1,143.91 in 2019.
13. Connecticut: $1,393.90 per Insured Car

Connecticut ranks 13th, with an average expenditure of $1,393.90 per insured vehicle in 2023. That was up about 9.0% from $1,279.23 in 2022. Its combined average premium was $1,508.21.
Connecticut is an at-fault (tort) state with minimum liability limits of 25/50/25. The state also requires uninsured and underinsured motorist coverage.
Connecticut had one of the smallest five-year increases on this list: its average expenditure rose 10.0%, from $1,266.79 in 2019. Liability coverage averaged $853.74 in 2023, the 11th highest, and collision averaged $477.53, the tenth highest. Comprehensive coverage was cheaper than in most states, at $176.94. In other ways Connecticut matches the NAIC’s profile of a high-premium state: it had the second-highest per capita disposable income ($67,460 in 2022), the fourth-highest population density (747 people per square mile) and the eighth-heaviest traffic per highway mile.
14. South Carolina: $1,367.39 per Insured Car
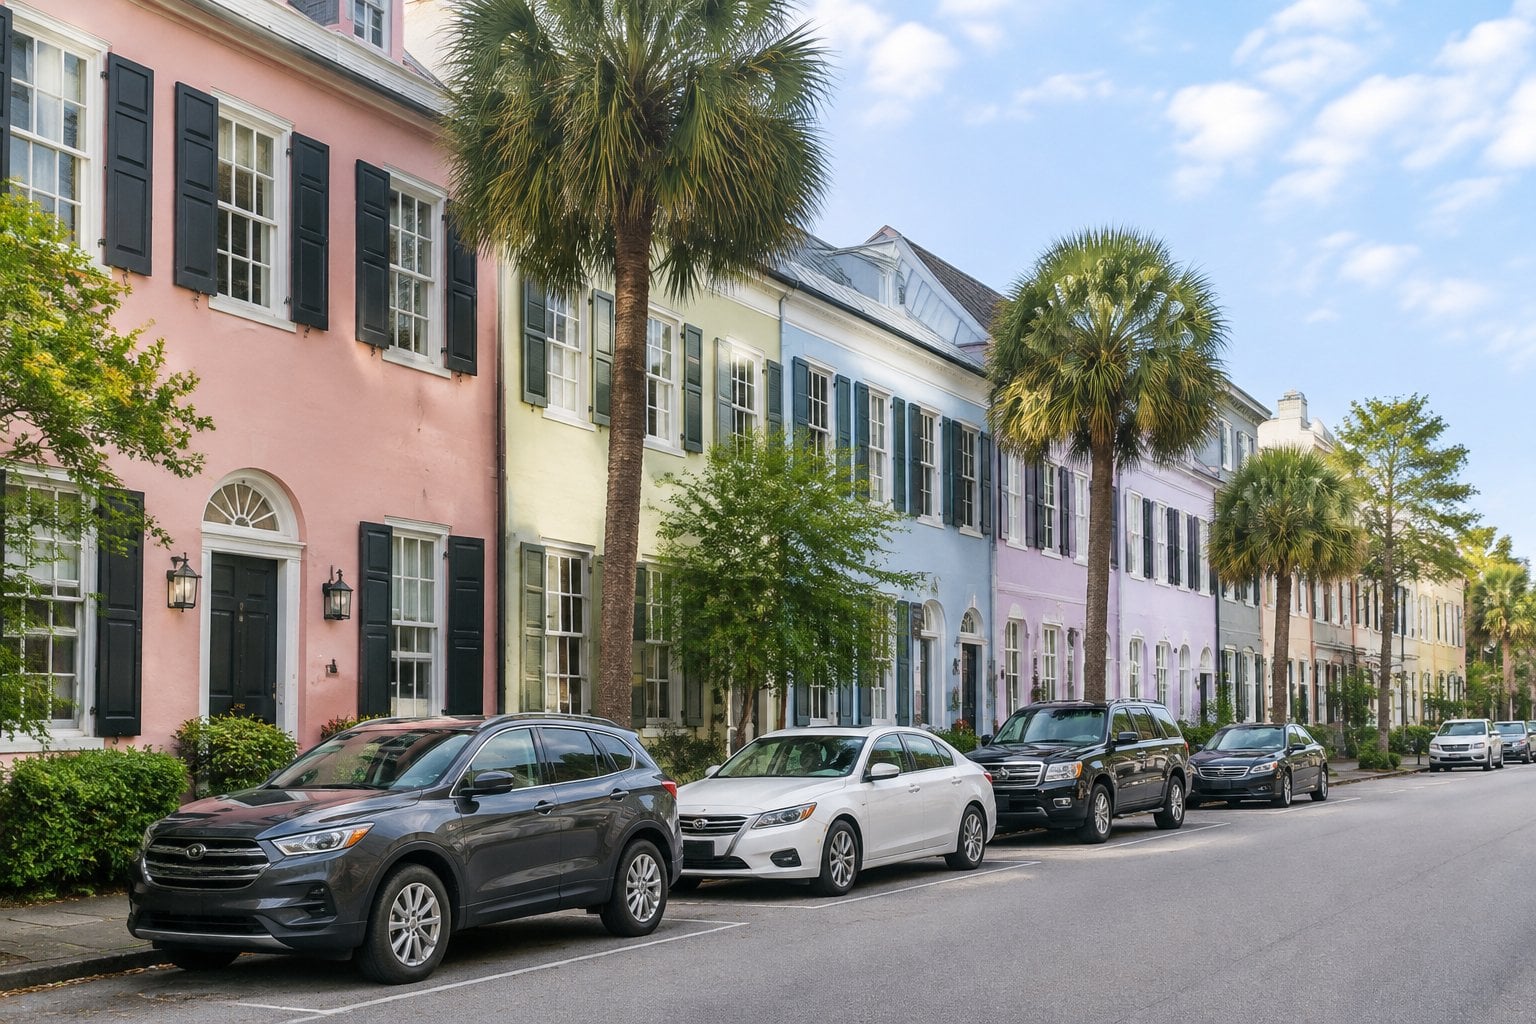
South Carolina ranks 14th, with an average expenditure of $1,367.39 per insured vehicle in 2023. That was up about 13.5% from $1,205.00 in 2022.
Its combined average premium was $1,516.71. South Carolina is an at-fault (tort) state with minimum liability limits of 25/50/25.
South Carolina had the highest fatal accident rate of any state in the NAIC report: 1.85 per 100 million vehicle miles in 2022, compared with 1.33 nationally. Its average liability premium was $879.40 in 2023, the ninth highest in the country. Collision coverage was cheaper than average, at $386.48, while comprehensive averaged $250.82. The state’s average expenditure rose 22.6% over five years, from $1,115.78 in 2019. Liability coverage there averaged $718.62 in 2019, so it rose about 22% in four years. Per capita disposable income was $47,058 in 2022, the sixth lowest of any state.
15. Arizona: $1,344.24 per Insured Car
Arizona ranks 15th, with an average expenditure of $1,344.24 per insured vehicle in 2023. That was up about 16.4% from $1,154.50 in 2022, the third-biggest increase on this list after Florida and Virginia. Its combined average premium was $1,504.59.
Arizona is an at-fault (tort) state. Its minimum limits rose to 25/50/15 for policies issued or renewed starting July 1, 2020.
Arizona also had the second-biggest five-year increase on this list, after Virginia: its average expenditure rose 26.2%, from $1,065.01 in 2019. Liability coverage averaged $792.89 in 2023, the 13th highest in the country, while collision averaged $436.44 and comprehensive $275.26. The NAIC report lists Arizona’s fatal accident rate at 1.71 per 100 million vehicle miles in 2022, the fifth highest of any state. It’s also highly urban, with 89.3% of residents living in urban areas in 2020.
16. Massachusetts: $1,326.46 per Insured Car

Massachusetts ranks 16th, with an average expenditure of $1,326.46 per insured vehicle in 2023. That was up about 11.4% from $1,191.02 in 2022. Its combined average premium was $1,413.49.
Massachusetts is a no-fault state with a $2,000 threshold for lawsuits. Its minimum limits changed a lot after the 2023 data year: for policies issued or renewed on or after July 1, 2025, they rose from 20/40/5 to 25/50/30, so the property damage minimum went from $5,000 to $30,000.
Massachusetts had the highest per capita disposable income of any state in the NAIC report, $68,874 in 2022, and it’s the third most densely populated, with 900 people per square mile. Its roads are among the safest: the fatal accident rate was 0.76 per 100 million vehicle miles, second lowest after Rhode Island. Vehicle theft was 1.38 per 1,000 registered vehicles, well below the national rate of 3.47. Its average liability premium ($710.19) was below the national average, but collision coverage averaged $519.88, the seventh highest.
17. California: $1,225.02 per Insured Car

California ranks 17th, with an average expenditure of $1,225.02 per insured vehicle in 2023. That was up about 12.7% from $1,086.60 in 2022. Its combined average premium was $1,417.94. The NAIC notes that its recent California data is preliminary.
California is the first state on this list below the national average of $1,281.92.
It’s an at-fault (tort) state, and its minimums went up after the data year. Under California Vehicle Code § 16056, policies issued or renewed on or after January 1, 2025 need at least 30/60/15, up from 15/30/5.
California has the most expensive collision coverage in the country: the average collision premium was $607.06 in 2023, compared with $463.71 nationally. Its liability premium ($660.84) was below the national average, and comprehensive coverage was among the cheapest, at $150.04, even though California had the fourth-highest vehicle theft rate (6.14 per 1,000 registered vehicles in 2022). It’s also the most urban state on this list, with 94.2% of residents living in urban areas in 2020, and its traffic per highway mile was the fifth heaviest. Over five years, its average expenditure rose 16.5%, from $1,051.82 in 2019.
18. Mississippi: $1,199.52 per Insured Car
Mississippi ranks 18th, with an average expenditure of $1,199.52 per insured vehicle in 2023. That was up about 13.1% from $1,060.90 in 2022.
Its combined average premium was $1,394.52. Mississippi is an at-fault (tort) state with minimum liability limits of 25/50/25.
Mississippi is the least urban state on this list, with 46.3% of residents in urban areas in 2020, and it had the lowest per capita disposable income of any state in the NAIC report ($42,170 in 2022). Its drivers also log a lot of miles, about 17,621 per registered vehicle in 2022. The state’s fatal accident rate, 1.76 per 100 million vehicle miles, was the second highest after South Carolina. Comprehensive coverage averaged $314.13 in 2023, well above the national figure. Over five years, the average expenditure rose 22.7%, from $977.79 in 2019.
19. Oregon: $1,170.31 per Insured Car
Oregon ranks 19th, with an average expenditure of $1,170.31 per insured vehicle in 2023. That was up about 16.4% from $1,005.65 in 2022, when Oregon’s average was just over $1,000. Its combined average premium was $1,268.47.
Oregon is an at-fault (tort) state with minimum liability limits of 25/50/20. The NAIC lists personal injury protection as required in Oregon.
Oregon’s average liability premium was $751.17 in 2023, slightly above the national average, while collision ($352.06) and comprehensive ($165.24) were both well below average. The state had the sixth-highest vehicle theft rate in the NAIC report, 5.81 per 1,000 registered vehicles in 2022, and the seventh-highest fatal accident rate, 1.64 per 100 million vehicle miles. Oregon’s average expenditure actually dipped from $990.24 in 2019 to $947.01 in 2021 before climbing past $1,000 in 2022.
20. Utah: $1,168.93 per Insured Car

Utah ranks 20th, with an average expenditure of $1,168.93 per insured vehicle in 2023. That was up about 14.1% from $1,024.11 in 2022. Its combined average premium was $1,284.60.
Utah is a no-fault state with a $3,000 threshold for lawsuits. Its minimum liability limits rose to 30/65/25 for policies issued or renewed on or after January 1, 2025.
Utah’s average liability premium was $746.43 in 2023, slightly above the national average of $736.65. Its collision ($378.17) and comprehensive ($160.01) premiums were both below average, and comprehensive was among the cheapest in the country. The state had one of the lower fatal accident rates in the NAIC report, 0.93 per 100 million vehicle miles in 2022. Utah is sparsely populated, at 41 people per square mile, but 89.8% of its residents lived in urban areas in 2020. Over five years, its average expenditure rose 22.5%, from $954.53 in 2019.
21. Missouri: $1,154.78 per Insured Car

Missouri ranks 21st, with an average expenditure of $1,154.78 per insured vehicle in 2023. That was up about 15.1% from $1,003.60 in 2022.
Its combined average premium was $1,322.55. Missouri is an at-fault (tort) state with minimum liability limits of 25/50/25.
Missouri’s liability premium was well below the national average, at $614.25 in 2023, but its comprehensive coverage averaged $307.96, the 14th highest in the country. Collision coverage averaged $400.34, below the national average of $463.71. The state had the seventh-highest vehicle theft rate in the NAIC report, 5.78 per 1,000 registered vehicles in 2022, up from 4.46 the year before. Missouri drivers also put on more miles than most: 15,161 per registered vehicle in 2022, compared with 11,708 nationally. Its average expenditure rose 23.7% over five years, from $933.54 in 2019.
22. Pennsylvania: $1,154.57 per Insured Car

Pennsylvania finished just 21 cents behind Missouri. Its average expenditure was $1,154.57 per insured vehicle in 2023, up about 13.5% from $1,017.59 in 2022. Its combined average premium was $1,273.46.
Pennsylvania drivers choose their lawsuit option (the NAIC lists the threshold as “choice”). The minimum liability limits are 15/30/5, among the lowest in the country, and policies must also include $5,000 of medical benefits.
Pennsylvania’s average liability premium was $567.27 in 2023, well below the national average of $736.65 and lower than in any state ranked above it on this list. Collision ($465.30) and comprehensive ($240.89) were both almost exactly at the national averages. The state’s vehicle theft rate was low, at 2.04 per 1,000 registered vehicles in 2022. Pennsylvania’s average expenditure stayed under $1,000 from 2019 through 2021, then rose 16.0% over the five years, from $995.08 in 2019 to $1,154.57 in 2023.
23. Illinois: $1,153.11 per Insured Car

Illinois ranks 23rd, with an average expenditure of $1,153.11 per insured vehicle in 2023. That was up about 16.0% from $993.88 in 2022, when it was still under $1,000. Its combined average premium was $1,256.58.
Illinois is an at-fault (tort) state with minimum liability limits of 25/50/20.
Illinois’s average premiums were below the national figures for all three main coverages in 2023: liability averaged $597.91, collision $439.90 and comprehensive $218.77. Comprehensive coverage still rose sharply, from $171.50 in 2022, about 27.6% in one year. The state’s vehicle theft rate jumped from 2.05 per 1,000 registered vehicles in 2021 to 3.54 in 2022, slightly above the national rate of 3.47. Illinois had 227 people per square mile in 2022, and 86.9% of its residents lived in urban areas in 2020. Over five years, Illinois’s average expenditure rose 22.6%, from $940.92 in 2019.
24. Washington: $1,152.50 per Insured Car

Washington ranks 24th, with an average expenditure of $1,152.50 per insured vehicle in 2023. That was up about 9.9% from $1,048.33 in 2022. Its combined average premium was $1,234.68.
The NAIC lists Washington as an add-on state. Its minimum liability limits are 25/50/10.
Washington had the smallest five-year increase of any state on this list (Michigan’s figure went down): its average expenditure rose 7.9%, from $1,068.26 in 2019. Washington drivers put on the fewest miles of any state on this list, about 7,686 per registered vehicle in 2022, compared with 11,708 nationally. The state did have the second-highest vehicle theft rate in the NAIC report, 6.56 per 1,000 registered vehicles, up from 3.89 in 2020. Even so, comprehensive coverage averaged only $153.93 in 2023, among the cheapest. Liability averaged $708.06 and collision $372.69.
25. Virginia: $1,114.46 per Insured Car
Virginia ranks 25th, with an average expenditure of $1,114.46 per insured vehicle in 2023, almost exactly at the NAIC’s median state figure of $1,114.
It had the second-biggest increase on this list after Florida: about 17.3%, from $949.76 in 2022. Its combined average premium was $1,238.13.
Virginia is an at-fault (tort) state, and its minimums went up after the data year. Under Virginia Code § 46.2-472, policies effective on or after January 1, 2025 need at least 50/100/25, up from 30/60/20.
Virginia’s average expenditure was $858.75 in 2019 and still only $863.73 in 2021, then rose quickly, for a five-year increase of 29.8%, the biggest on this list. Liability coverage averaged $626.63 in 2023, up from $493.55 in 2019, while collision averaged $407.01 and comprehensive $204.49, both below the national averages. The state’s vehicle theft rate was low, at 1.86 per 1,000 registered vehicles in 2022, about half the national rate.
26. Alaska: $1,112.96 per Insured Car
Alaska ranks 26th, with an average expenditure of $1,112.96 per insured vehicle in 2023. That was up about 9.8% from $1,013.94 in 2022. Its combined average premium was $1,262.49.
Alaska is an at-fault (tort) state, and its minimum liability limits of 50/100/25 are among the highest in the country.
Alaska is the least densely populated state, with about one person per square mile in 2022, and its highways carry far less traffic than most: 310,609 vehicle miles per highway mile, compared with 761,461 nationally. Its per capita disposable income was $62,277, the tenth highest. Liability coverage averaged $624.01 in 2023, below the national average despite the state’s high minimum limits, while collision averaged $458.33, close to the national figure. Over five years, Alaska’s average expenditure rose 12.3%, from $991.00 in 2019.
27. Minnesota: $1,103.05 per Insured Car
Minnesota ranks 27th, with an average expenditure of $1,103.05 per insured vehicle in 2023. That was up about 14.7% from $961.76 in 2022. Its combined average premium was $1,223.48.
Minnesota is a no-fault state. A lawsuit for pain and suffering generally needs $4,000 in medical expenses or a serious injury of a type the law describes, which the NAIC lists as “$4,000 or verbal.” The minimum liability limits are 30/60/10.
Comprehensive coverage is where Minnesota stands out: it averaged $320.72 in 2023, the tenth highest in the country and up from $214.64 in 2019. Liability ($542.43) and collision ($360.33) were both well below the national averages. The state also had one of the lowest fatal accident rates in the NAIC report, 0.77 per 100 million vehicle miles in 2022, third lowest after Rhode Island and Massachusetts. Minnesota’s average expenditure rose 23.7% over five years, from $892.05 in 2019.
28. Oklahoma: $1,083.97 per Insured Car

Oklahoma ranks 28th, with an average expenditure of $1,083.97 per insured vehicle in 2023. That was up about 13.1% from $958.51 in 2022.
Its combined average premium was $1,324.15, higher than in several states ranked above it, including Missouri, Pennsylvania and Washington. Oklahoma is an at-fault (tort) state with minimum liability limits of 25/50/25.
Oklahoma’s comprehensive coverage averaged $337.76 in 2023, the ninth highest in the country, while its liability premium ($565.91) was among the lower ones. Collision averaged $420.48. Oklahoma drivers put on about 13,957 miles per registered vehicle in 2022, above the national figure of 11,708. The state had the 11th-highest vehicle theft rate in the NAIC report (3.97 per 1,000 registered vehicles in 2022) and the tenth-highest fatal accident rate (1.59 per 100 million vehicle miles). Over five years, its average expenditure rose 18.6%, from $913.63 in 2019.
29. New Mexico: $1,081.61 per Insured Car
New Mexico ranks 29th, with an average expenditure of $1,081.61 per insured vehicle in 2023. That was up about 13.0% from $957.50 in 2022. Its combined average premium was $1,301.12.
New Mexico is an at-fault (tort) state with minimum liability limits of 25/50/10.
New Mexico had the third-highest vehicle theft rate of any state in the NAIC report, 6.29 per 1,000 registered vehicles in 2022, and the third-highest fatal accident rate, 1.74 per 100 million vehicle miles. Its drivers average about 14,795 miles per registered vehicle, well above the national figure of 11,708, and it is the sixth least densely populated state, with 17 people per square mile. Liability coverage averaged $623.83 in 2023, collision $418.17 and comprehensive $259.13. The state’s average expenditure fell from $932.65 in 2019 to $892.50 in 2021 before rising to $1,081.61 in 2023.
30. Alabama: $1,081.24 per Insured Car

Alabama rounds out the list, just 37 cents behind New Mexico. Its average expenditure was $1,081.24 per insured vehicle in 2023, up about 11.9% from $966.10 in 2022. Its combined average premium was $1,268.71.
Alabama is an at-fault (tort) state with minimum liability limits of 25/50/25. The next state on the NAIC list, West Virginia, was at $1,062.98.
Alabama’s average premiums were close to or below the national averages in 2023: liability averaged $575.51, collision $452.04 and comprehensive $241.16. Its per capita disposable income, $45,248 in 2022, was the third lowest of any state in the NAIC report, and 57.7% of residents lived in urban areas in 2020, one of the lower shares on this list. The state’s vehicle theft rate was 2.09 per 1,000 registered vehicles. Over five years, its average expenditure rose 16.6%, from $927.51 in 2019.
What the NAIC Numbers Do and Don’t Show
The NAIC average is a statewide estimate of what was spent, not a price quote. It doesn’t adjust for the drivers, cars, coverage limits or deductibles in each state, or for differences in state laws and traffic. The NAIC itself warns that direct comparisons between states “should be treated with a high degree of caution.”
The report lists many things that affect prices from state to state, including vehicle theft rates, repair costs, population density, medical and legal costs, income levels, rate filing laws and liability requirements. It notes that high-premium states tend to be highly urban, with higher wages and prices and heavier traffic.
At the other end of the scale, the cheapest state in 2023 was North Dakota, at $807.77 per insured vehicle. Several states on this list (California, Massachusetts, New Jersey, Utah and Virginia) have raised their minimum limits since 2023, so the minimums above are current law, while the dollar figures are from 2023.
If you want to see how insurance fights play out in court, read our look at the biggest insurance lawsuits in U.S. history, or our list of the biggest Geico lawsuits.
This article is for general information only and is not legal or financial advice. Insurance requirements and prices change over time and differ by state, insurer and driver, so check your state insurance department or your own policy for current details.


